Introduction
Detailed interpretation of complex facies intervals within high-resolution 3D seismic data is a tedious and time-consuming process, even with the assistance of traditional deep learning methods. Traditional windowed waveform classification algorithms can have a non-unique solution and are impacted heavily by interpreter bias and laterally varying data quality. This is especially the case in deformed facies intervals such as post-depositional deformation of complex geological sequences, where tectonic reactivation and/or salt tectonism have re-worked sequences of post-salt siliciclastics into complicated packages that are difficult to interpret. These heavily re-worked zones subjected to erosion and re-deposition of growth sequences are prolific throughout the North Sea and can play an important role in fluid migration and containment. The sediments within the sequence of interest are post-depositional to original salt deposition and syn-depositional to halokinesis. Their complexity usually means such sequences are under-interpreted, which introduces pre-drill uncertainties about the well path or target itself (Tang et. al. 2012).
Therefore, we propose a new, data-centric, and interactive deep learning methodology using InteractivAI, which leverages neural networks to accurately yet quickly predict separate deformed facies in the Groningen study area. The results presented below were obtained in a fraction of the time compared to traditional interpretation workflows and allow geoscientists to better characterize complex geologic units while also determining potential impacts on prospective petroleum systems or planned well paths.
Geologic Background
The Groningen study area is located onshore The Netherlands (Figure 1a). The gas reservoir area is characterized by a classic four-way closure with salt providing a competent regional top seal and lateral stratigraphic pinch-outs providing closure. Regional geometry is shaped by North Sea extensional/reactivation tectonics and local structure controlled by salt movement. The Upper Rotliegend Group was deposited during the Permian in a broad basin and is locally comprised of the entire sequence above the Base Permian Unconformity (BPU) and below the overlying Zechstein Formation (Figure 1b) (Boogaert 1976). As the trend is followed eastward, an older Lower Rotliegend Group sequence made up of volcaniclastic sediments is also present in extensional-fault-bounded grabens.
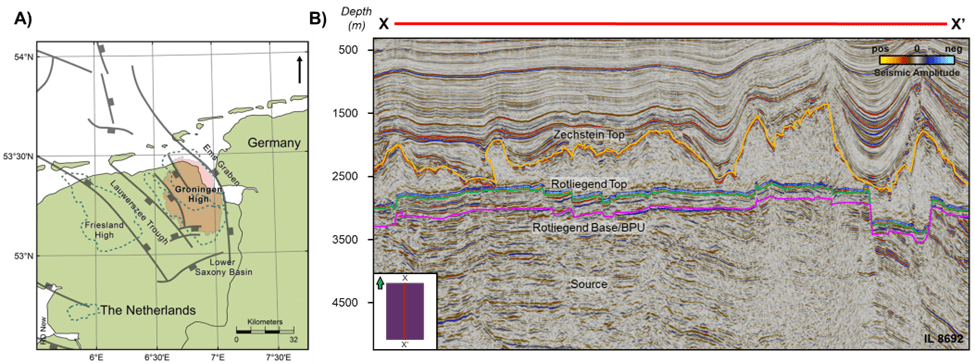
Figure 1: A) Location map of the Groningen High, The Netherlands (modified after Kortekaas et. al. 2017) whereas B) highlights key geologic intervals on an interpreted inline.
Available Data
The seismic dataset is a post-stack, depth migrated onshore survey that is SEG negative polarity, where the sea floor is observed as a peak. To best demonstrate the proposed methodology, the volume was cropped volume without vertical masking or additional sub-setting. Publicly available well data with complete log suites were used as the basis for initial labeling and were carried out from the well location as far as could be visually determined. The Siddeburen wells were selected for their robust log data and seismic ties.
Methodology
Many recent studies (LeCun et al. 2015; Bandura et al. 2018; Chopra and Marfurt 2018; Chenin and Bedle 2022, Salamoff et al. 2022) have shown promising applications of machine learning techniques that aid in the recognition and classification of different seismic reflection patterns. In this study, we employ a data-centric, interactive deep learning approach, where data labeling/classification, network training, and class predictions happen simultaneously. This is only made possible by leveraging the VDS format, which can adaptively stream randomized images directly into TensorFlow.
Geoscientists provide active positive and negative reinforcement feedback to a binary or multiclass deep learning network during the training process and before generation of final classification probability results. Masking and validation methods were used to focus the training on relevant data and mitigate overfitting. Geologically-accurate and detailed salt and deformed facies models within the Groningen study area were generated by using a combination of interactive feedback reinforcement, data masking, and validation techniques.
Results
A total of 7 inlines (ILs) and 6 crosslines (XLs) were labeled for salt identification (~0.38% of the dataset). The network type used was an interactive, binary U-Net with a Weighted Root Mean Square Error (RMSE) loss function applied. The model was trained for 14 epochs, where it took approximately 1.5 hours to train the network and generate the salt probability cube and automatically extract a 3D geobody (Figure 2a-b). This probability cube could then be used as a 3D mask to exclude from further detailed seismic deep learning (Figure 2c).
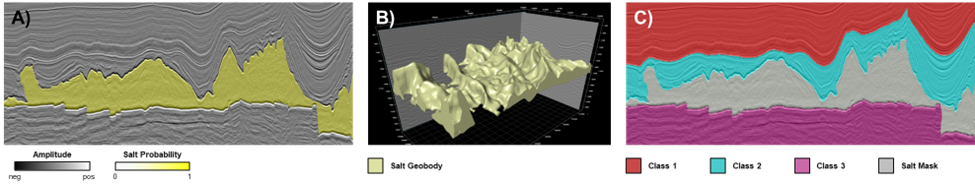
Figure 2: A) Final prediction results for salt with B) the extracted geobody. C) Showcases how the salt results were used as a mask (grey) for the 3D stratigraphic framework to isolate the deformed facies layer (shown in blue).
The interval of interest containing deformed/re-worked sediments was divided into four distinct packages based on well log data and seismic waveform character (Figure 3a-c). A 3D mask was used to focus only on data pertinent to the mapping of deformed facies, while ignoring all other data in the survey. Initial labels were placed on one inline, and a sparse labeling method was used to surgically add labels on specific regions of the seismic where the prediction quality was poor. The network type used was an E-Net with a mix of Focal and Dice loss function applied, where 8 ILs and 6 XLs were labeled (0.41% of the dataset). The entire labeling and training process, including generation of probability cubes and application of masks, took roughly 10.5 hours (Figure 3b).
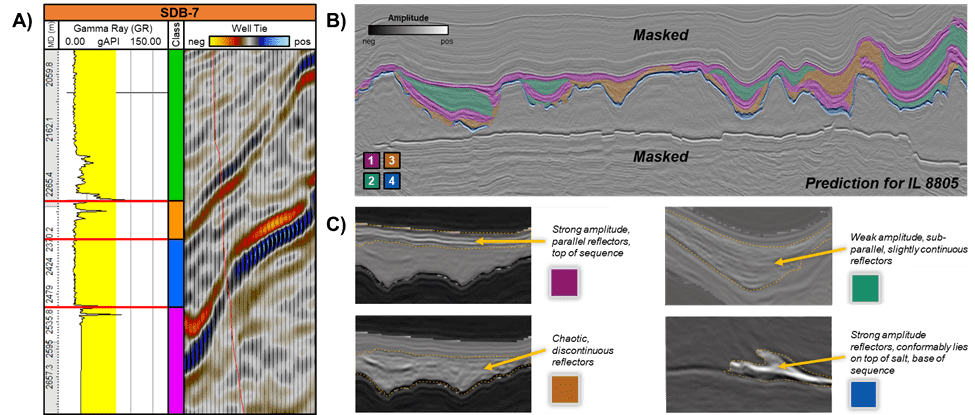
Figure 3: A) Labeled classes from one of the Siddeburen wells which were used to train the multiclass neural network. B) Highlights the final prediction results on the masked deformed facies layer. C) Character groups and related label/inference color used.
Three validation lines were used to optimally train the salt network. No validation was used for the deformed facies model due to the complexity of the interval and uncertainty regarding similar seismic character, which could introduce interpreter bias. Training halted when there was no improvement in validation performance metrics over the span of 10 epochs.
Discussion
The trained and finalized deformed facies multiclass network achieved geologically plausible and consistent predictions, where well log data strongly supported the results from deep learning, without any further corrective action necessary (Figure 4a). The 3D distribution of salt and these deformed facies can then be used to influence target selection and operational de-risking (Figure 4b). Full 3D manual mapping of this type of interval is extremely challenging, where even assorted waveform classification and traditional deep learning algorithms produce noisy and ambiguous results.
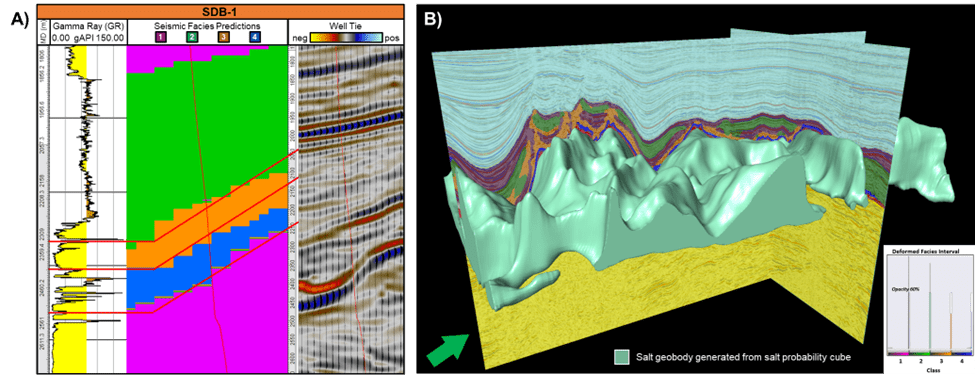
Figure 4: A) Close-up of the SDB-1 gamma ray log next to final classification volume and seismic amplitude. Note the close relationship between labeled classes and major changes to the gamma response. Red lines indicate top/base facies. B) Output classification co-rendered with seismic amplitude and the salt geobody (teal) in a 3D interpretation application.
Conclusions
The proposed data-centric, interactive deep learning workflow using InteractivAI was effective for mapping complex intervals with divergent seismic waveform characteristics, such as re-worked facies intervals or deformed salt. This workflow can be applied to any geological or geophysical feature, such as diagenetic front mapping, classification of a clinoform into individual foreset packages, and 3D interpretation of complicated salt-anhydrite stacks (such as those found in Santos & Campos Basins, offshore Brazil).
While some slight misclassifications are present within all network results, the networks were able to successfully isolate, identify, and classify the complex 3D geologic zone of interest at a high-level of detail. This simultaneous feedback serves as a built-in QC tool, helping the geoscientist refine the binary and multiclass layers via label optimization as well as the quality of the network training set and results. The interactive deep learning methodology demonstrated here enables the generation of impactful results that are difficult to map using traditional interpretation methods.
Acknowledgements
We thank NLOG Dutch Oil and Gas Portal, The Netherlands for providing access to the seismic and well datasets and the Bluware Geoscience team for their contributions to this study.
References
Bandura, L., S. Halpert, and Z. Zhang, 2018, Machine Learning in the Interpreter’s toolbox: unsupervised, supervised, and deep learning applications: 88th Annual SEG Expo, https://doi.org/10.1190/segam2018-2997015.1.
Boogaert, A., 1976, Outline of the Rotliegend (lower permian) in The Netherlands. In: The Continental Permain in Central, West, and South Europe. Springer, Dordrecht, 23-37.
Chenin, J., and H. Bedle, 2022, Unsupervised Machine Learning, Multi-Attribute Analysis for Identifying Low Saturation Gas Reservoirs within the Deepwater Gulf of Mexico, and Offshore Australia: Geosciences, 12, no. 3, 132, https://doi.org/10.3390/geosciences12030132.
Chopra, S., and K. J. Marfurt, 2018, Seismic facies classification using some unsupervised machine-learning methods: SEG 2018 Technical Program, Expanded Abstracts, 2056-2060, https://doi.org/10.1190/segam2018-2997356.1.
Kortekaas, M., and B. Jaarsma, 2017, Improved definition of faults in the Groningen field using seismic attributes: Netherlands Journal of Geosciences, 96, no. 5, s71-s85. https://doi.org/10.1017/njg.2017.24.
LeCun, Y., Y. Bengio, and G. Hinton, 2015, Deep Learning: Nature, 521, no. 7553, 436-444, https://doi.org/10.1038/nature14539.
Salamoff, S., J. Chenin, B. Lartigue, N. Phan, and P. Endresen, 2022, Detailed petroleum system insights using deep learning: A case study from the Scarborough Gas Field, offshore Australia: SEG/AAPG International Meeting for Applied Geoscience & Energy, Extended Abstracts, https://doi.org/10.1190/image2022-3749309.1.
Tang, L., T. Huang, H. Qiu, L. Qi, Y. Yang, D. Xie, Y. Yu, Z. Zhao, and S. Chen, 2012, Salt-related structure and deformation mechanism of the Middle-Lower Cambrian in the middle-west parts of the Central Uplift and adjacent areas of the Tarim Basin: Science China Earth Sciences, 55, no. 7, 1123–1133, https://doi.org/10.1007/s11430-012-4414-3.