INTERACTIVE DEEP LEARNING FOR COMPLEX GEOLOGICAL FEATURES​

INTEGRATING BLUWARE INTERACTIVAI DEEP LEARNING FOR COMPLEX GEOLOGICAL FEATURES: A CASE STUDY FROM THE SANTOS BASIN, OFFSHORE BRAZIL

Julian Chenin, Scotty Salamoff, Ana Krueger, Benjamin Lartigue, Nguyen Phan

INTRODUCTION

Detailed stratigraphic and structural geomodelling within high-resolution, 3D seismic data is a tedious and time-consuming process. This is especially the case within the geologically complex Santos Basin, offshore Brazil (Fiduk and Rowan, 2012; Jackson et al., 2014; Fainstein et al., 2018).

In recent years, there have been several deep learning approaches with sophisticated neural network architectures that show a lot of potential when applied to tedious seismic imaging and interpretation tasks (LeCun et al., 2015; Bandura et al., 2018). These deep learning workflows accelerate such interpretations, shifting the focus of petroleum geoscientists from exhaustively digitizing features on a workstation, to critical evaluation and risk/resource analysis of the play. Bluware’s InteractivAI Deep Learning methodology utilizing neural networks are revolutionizing traditional seismic interpretation tasks by accelerating the speed at which geologic features can be mapped. Using data from the structurally complex Santos Basin, offshore Brazil, we introduce this interactive deep learning methodology which enables the interpreter to exert more control over network predictions in real-time.

The Santos Basin evaporite sequence contains a mix of different halide mineralogies, which creates intra-salt reflections easily mistaken as clastic sedimentary layers, as well as a barrier for seismic illumination.  We will demonstrate that the results from a well-trained deep learning network can accurately map the evaporite sequence, and identify faults above, within, and below the complex salt structures of the basin, which is traditionally a very challenging and time-consuming task in this area.

These results were obtained in a fraction of the time compared to traditional interpretation workflows and allow geoscientists to better characterize complex petroleum systems. With this methodology, geoscientists can visualize the regional trends, while bringing those observations to the petroleum system scale. By understanding the interaction between the salt structures and the faults, this gives the geoscientist a better understanding of the basin’s petroleum system to produce it safely yet efficiently.

GEOLOGIC BACKGROUND

The Santos sedimentary basin is located south of the Cabo Frio Arch, and underlies the shelf, slope, deepwater, and ultra-deepwater off Southeastern Brazil (Fainstein et al., 2018) (Figure 1). In this region, the basin experienced three mega-stages of sedimentation which define the basin stratigraphy and infill: pre-rift, rift, and post-rift.  (Fainstein et al., 2018). The Santos Basin is well-known for its complex structural and deformational history.

We present a methodology based on Bluware InteractivAI proprietary technology that provides random data access to seismic data and training labels. This enables a high degree of interactivity between the deep learning process and the interpreting geoscientist. Random access to data also eliminates the burden of data preparation because it does not require prior randomization of the seismic data. Therefore, the deep neural network acts as an extension of the interpreter to augment mapping capabilities of sub-surface geological features, such as faults or salt, using single amplitude or co-rendered seismic attribute volumes.

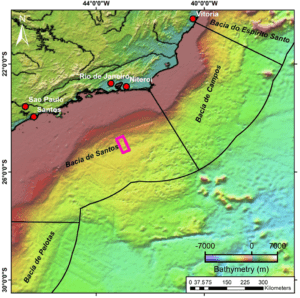
Figure 1: Location of the study area (shown in pink) within the Santos Basin, offshore Brazil. Seafloor bathymetry map taken from topex.ucsd.edu. 

METHODOLOGY AND DEEP LEARNING NETWORK

A myriad of recent studies (LeCun et al., 2015; Ronneberger et al., 2015; Bandura et al., 2018; Chopra and Marfurt 2018, Morris et al., 2019; Chenin et al., 2020) have shown promising applications of machine learning techniques that aid in the analysis and interpretation of geologic patterns. In this study, we apply Bluware’s interactive deep learning methodology which differs from pre-existing ones due to the high level of interactivity it provides between the deep learning process and the interpreter.

Random access to seismic data accelerates deep learning to enough to enable interactivity. Our methodology enables the data labeling, network training, and predictions to happen in real-time with different configurations; the geoscientist does not rely on “black box” utilities to generate a high-quality result. Since the network predictions, or inference, is happening in real-time, the geoscientist can provide active feedback and reinforcement to the deep learning network, while simultaneously training it. The geoscientist can keep training until the desired inference result is achieved. This method embeds quality control with training and interpretation, therefore removing the disadvantage of tedious and time-consuming quality control.


Figure 3 illustrates the key differences between traditional deep learning approaches and the interactive deep learning approach. As can be seen from the illustration, proprietary technology such as compression and random access to seismic data makes interactive deep learning possible. Other methodologies require significant data preparation steps before the process can be run. This is because TensorFlow records are static and cannot be modified on the fly. However, we will demonstrate through our methodology that this unnecessary burden is avoided (Figure 3).

SANTOS 3D SEISMIC DATA

This post-stack, depth migrated survey is located roughly 250 km south of Rio de Janeiro and covers approximately 1730 km2 in the Santos Basin, offshore Brazil (Figure 1). This data set is zero phase and SEG negative polarity, where the sea floor is observed as a peak. The initial SEG-Y file had a size of about 44 Gb and was compressed to a size of 2.5 Gb using Bluware’s VDS format with virtually no loss in amplitude.

RESULTS

A total of 15 inlines (IL) and crosslines (XL) were labeled for salt identification (~0.80% of the dataset) whereas a total of 5 ILs and XLs were labeled for fault identification (0.33% of the dataset). The networks for fault and salt identification were trained separately and used different ILs. The salt network was trained for 75 epochs, whereas the fault network was trained for 65 epochs. With an NVIDIA GeForce RTX 2080 Super graphics card, each epoch took roughly 45 seconds on a laptop.

Upon completing the initial round of training for both networks, the interpreter then reviewed the inferences co-rendered with the seismic amplitude data and revised their label set. In areas where the interpreter saw a prediction error, they could interactively add or delete labels to improve the algorithm’s inference. The network was retrained, and the labeling process was repeated until the desired level of accuracy and error was achieved.

Figure 5A-C highlights how well the CNN matches the labeled faults (green) within the seismic section (Figure 5A-B) while also inferring the faults on a non-labeled seismic section (yellow) (Figure 5C). The algorithm identified some faults that were missed (yellow) within the labeled (green) seismic amplitude section (Figure 5A-B). Also, the algorithm was able to pick out the deeper, continuous faults that extend from the pre-salt into the post-salt. These faults are critical as they serve as migration pathways for hydrocarbons from the pre-salt reservoirs to the post-salt turbidites in the shallower section (Figure 5A-C). Furthermore, the fault results are capturing the faults related to diapirism in the shallow section (Figure 5A-C). These shallow faults are important as they show the potential containment risk posed by the active faulting controlled by diapirism. Finally, these fault results help highlight the reservoir running room for both the shallow and deeper sections.


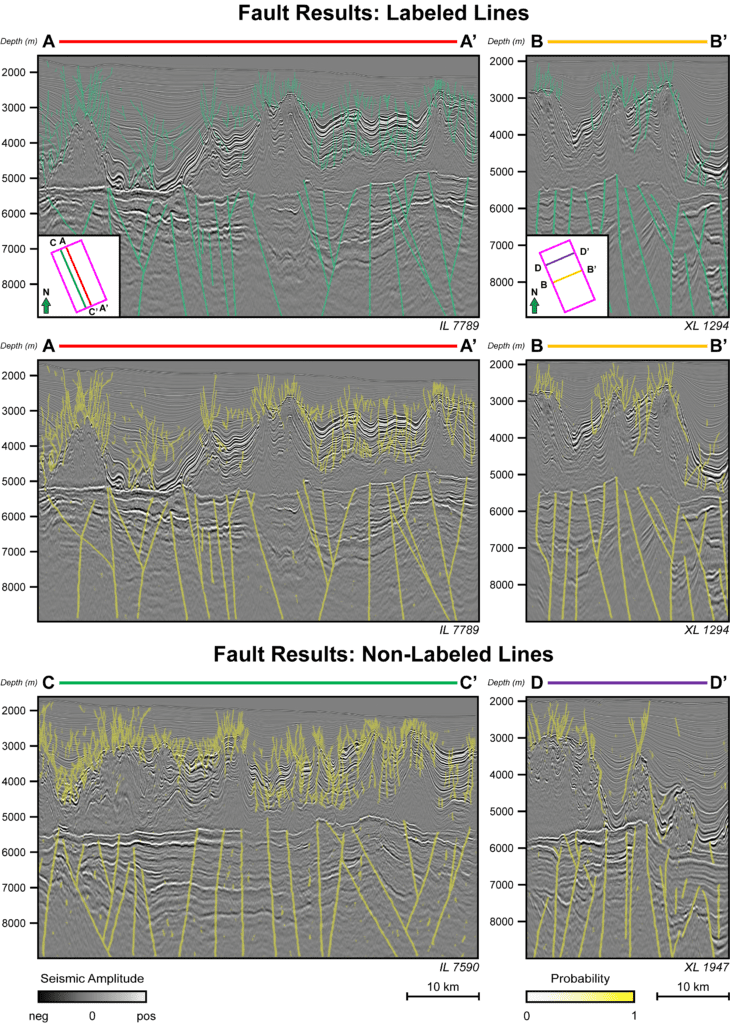
Figure 5: A) Faults labeled on an inline (IL) and crossline (XL) with B) its corresponding prediction from the deep learning network. The network shown here is after 65 epochs of training. C) shows the fault predictions on a non-labeled IL and XL. Only 0.33% of the data was labeled. Note how the CNN was able to accurately identify faults above, within and below the evaporite layer quite well.

Figure 6A-C illustrates the effectiveness of the CNN for identifying the autochthonous salt within the study area. Notice how the inference from the algorithm conforms with the salt interpretation on IL 7641 and XL 1294 with minimal false predictions (Figure 6A-B). The CNN was able to differentiate between the salt weld and the autochthonous salt in Figure 6B. Additionally, when looking at a non-labeled IL and XL, the algorithm was able to accurately infer the entire salt body (Figure 6C). In some areas, the salt adheres to a fault plane, yet the model was not trained with any faults (Figures 6B-C). The model does not know anything about faults yet is still able to predict the salt with the boundary in mind (Figure 6B-C).


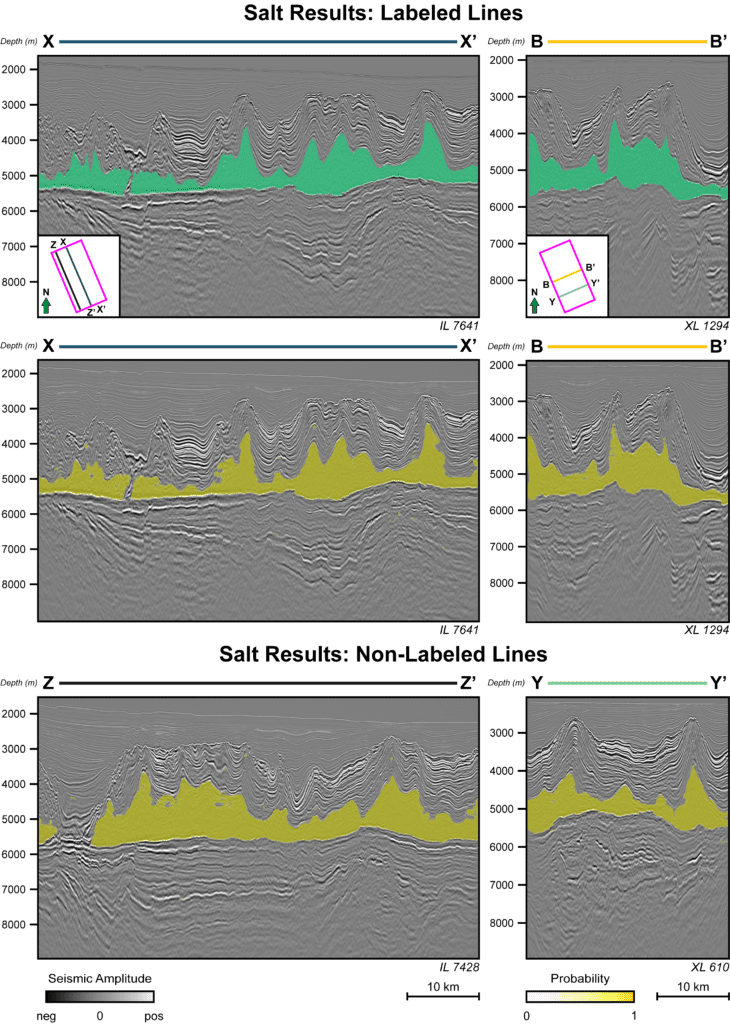
Figure 6: A) Salt labeled on an inline (IL) and crossline (XL) with B) its corresponding prediction from the deep learning network. The network shown here is after 75 epochs of training. Note how to algorithm’s inference were nearly identical to the interpretation with some slight misclassification. C) shows the salt predictions on a non-labeled IL and XL. Only 0.80% of the seismic data was labeled. Observe how the CNN was able to accurately identify the salt bodies within the seismic amplitude section.

While some slight misclassifications are present within both sections, the networks were able to isolate, identify, and classify these geologic features in a similar manner as a seismic interpreter (Figures 5-6). Once satisfied with the results, geobodies and fault sticks were extracted from the algorithm’s inference with minimal post-processing (Figure 7A-B). These results can be visualized together to understand the regional trends and relate them back to the petroleum system. Figure 7A-B captures the radial faulting structures quite well and reflect the tectonics related to active diapirism within the shallower section. These results can help showcase the reservoir running room within the shallow section, while also further characterizing the poorly illuminated pre-salt reservoirs.

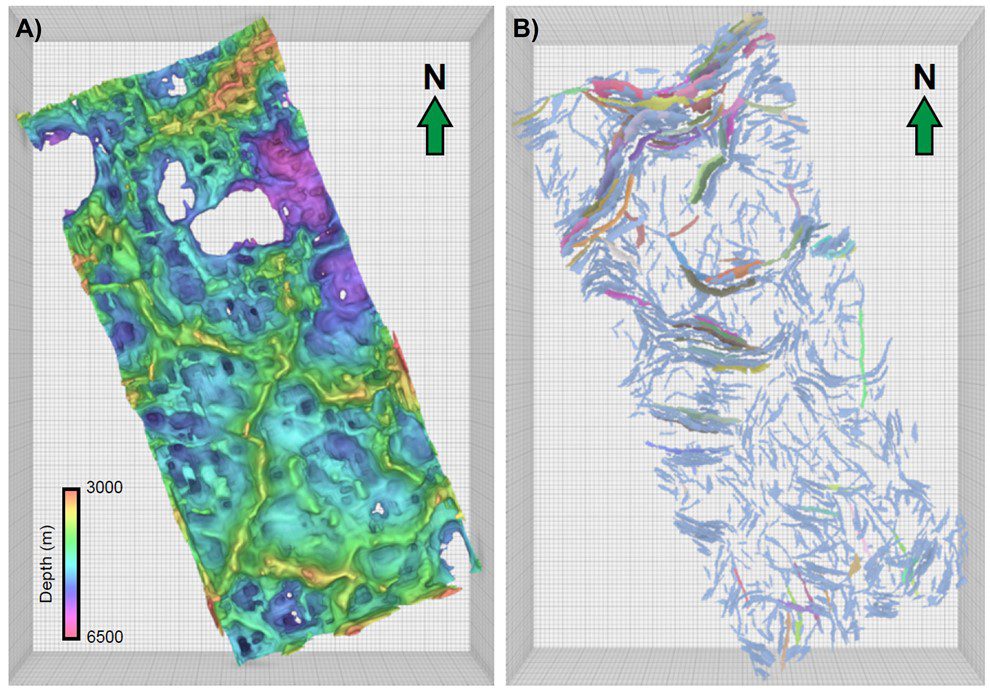
Figure 7: A) Salt geobody and B) fault sticks generated from the CNN’s inference for the entire seismic survey within the Santos Basin, offshore Brazil. Minimal post-processing, such as applying a gaussian smoothing of 4, was performed on the extracted salt geobody whereas the individual fault sticks were created using our in-house algorithms.


Figure 8 shows the extracted fault results visualized with the extracted salt geobody.

Figure 8: Salt geobody shown with the fault sticks created from the CNN’s inference for the entire seismic survey within the Santos Basin, offshore Brazil.


To further characterize the uncertainty of these results, the fault and salt probabilities can be co-rendered together to understand the high-confidence regions from the algorithms’ predictions (Figure 9A). Additionally, these results can be visualized in any 3D interpretation and visualization package (Figure 9B).


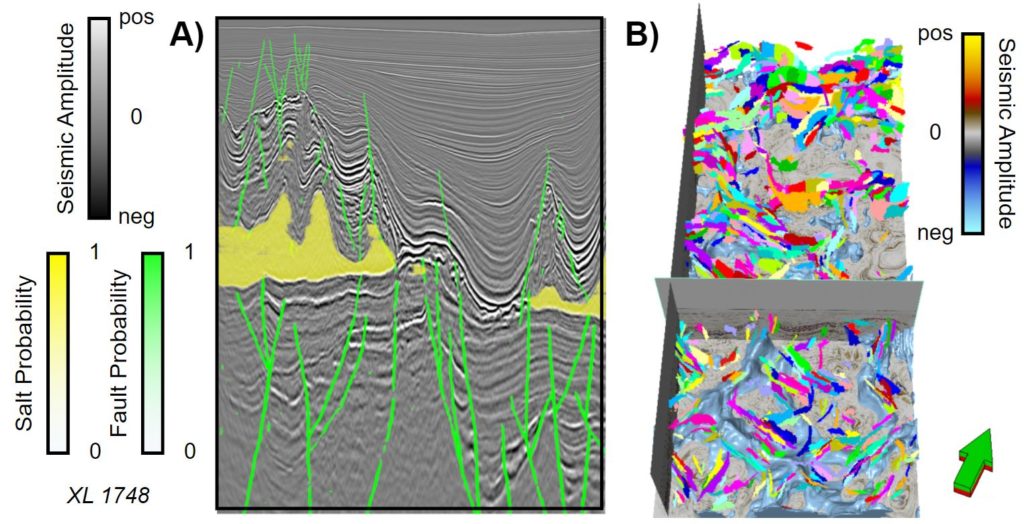
Figure 9: A) Co-rendered fault and salt probabilities on crossline 1748 and B) salt geobody shown with the fault sticks created from the CNN’s inference for the entire seismic survey visualized in another 3D interpretation package.


As a result of the interpreter working interactively with a deep learning engine, the network will suggest faults within the seismic section, such as ambiguous faults that may have been originally overlooked by the geoscientist. The algorithm can also help refine the geoscientist’s salt interpretation, allowing them to differentiate between the autochthonous salt and the multi-layered and multi-mineralogy evaporite sequence. These subtle geologic features that were identified by the algorithm enables the geoscientist to gain further insights into the complex petroleum system of the Santos Basin.

CONCLUSIONS

Bluware Interactive Deep Learning interpretation tool can improve interpretations while helping to reduce human error and optimize day-to-day exploration and production operations. Inferences are as reliable as manual interpretation. Geoscientists can trust the results of deep learning because they can work with the algorithm until the results are satisfactory. No post-processing quality control or surface editing is necessary while using Bluware InteractivAI. Inference and training are happening instantly, so quality control takes place during the labeling and training process. In this case, salt and fault predictions were accurate and captured the true extent of deformation throughout the basin by labelling only 1% of the data. These results have important implications for characterizing the remaining reservoir running room (for both the pre- and post-salt reservoirs) within the basin while capturing the basin’s complex petroleum system.


ACKNOWLEDGEMENTS

We thank ANP (Agencia Nacional de Petroleo) Brazil for providing access to this seismic and well dataset.

REFERENCES

Bandura, L., S. Halpert, and Z. Zhang, 2018, Machine Learning in the Interpreter’s toolbox: unsupervised, supervised, and deep learning applications: 88th Annual SEG Expo, https://doi.org/10.1190/segam2018-2997015.1.

Chenin, J., and H. Bedle, 2020, Multi-attribute machine learning analysis for weak BSR detection in the Pegasus Basin, Offshore New Zealand: Marine Geophysical Research, 41, no. 4, 1-20. https://doi.org/10.1007/s11001-020-09421-x.

Chopra, S., and K. J. Marfurt, 2018, Seismic facies classification using some unsupervised machine-learning methods: SEG Technical Program Expanded Abstracts 2018, 2056-2060, https://doi.org/10.1190/segam2018-2997356.1.

Chopra, S., and K. J. Marfurt, 2005, Seismic attributes—A historical perspective: Geophysics, 70, no. 5, 3SO-28SO, https://doi.org/10.1190/1.2098670.

Fainstein, R., A. Krueger, and W. Ueipass Mohriak, 2019, Ultra-deepwater seismic plays offshore Brazil—Future drilling off Santos and Campos Basins: Interpretation, 7, no. 4, SH99-SH109, https://doi.org/10.1190/INT-2018-0251.1.

Fiduk, J.C., and M. G. Rowan, 2012, Analysis of folding and deformation within layered evaporites in Blocks BM-S-8 &-9, Santos Basin, Brazil: Geological Society, London, Special Publications, 363, no. 1, 471-487. https://doi.org/10.1144/SP363.22.

Jackson, C. A. L., Rodriguez, C. R., Rotevatn, A., & Bell, R. E, 2014, Geological and geophysical expression of a primary salt weld: An example from the Santos Basin, Brazil: Interpretation, 2, no. 4, SM77-SM89. https://doi.org/10.1190/INT-2014-0066.1.

LeCun, Y., Y. Bengio, and G. Hinton, 2015, Deep Learning: Nature, 521, no. 7553, 436-444, https://doi.org/10.1038/nature14539.

Morris, M., S. Brazell, and P. Lu, 2018, Machine-derived seismic interpretation: real world examples & lessons learned: SEG Technical Program Expanded Abstracts 2018, 4659-4663, https://doi/10.1190/segam2018-3001897.1.

Ronneberger, O., P. Fischer, and T. Brox, 2015, U-net: Convolutional networks for biomedical image segmentation: International Conference on Medical Image Computing and Computer-Assisted Intervention 2015, 9351, 234-241, https://doi.org/10.1007/978-3-319-24574-4_28.

Let’s Chat

Are you ready to enter the next generation of subsurface data management and workflows?